Field monitoring for LMS1xx, LMS5xx, TiM7xx and TiM7xxS
The LMS1xx, LMS5xx, TiM7xx and TiM7xxS families have the following extended settings for field monitoring:
Field monitoring messages
LMS1xx, LMS5xx, TiM7xx and TiM7xxS scanner support field monitoring. Fields can be configured by Sopas ET. Once they are configured, sick_scan_xd publishes ros messages containing the monitoring information from the lidar.
By default, field monitoring is enabled in the launch files sick_lms_1xx.launch, sick_lms_5xx.launch, sick_tim_7xx.launch resp. sick_tim_7xxS.launch by following settings:
<param name="activate_lferec" type="bool" value="True"/> <!-- activate field monitoring by lferec messages -->
<param name="activate_lidoutputstate" type="bool" value="True"/> <!-- activate field monitoring by lidoutputstate messages -->
<param name="activate_lidinputstate" type="bool" value="True"/> <!-- activate field monitoring by lidinputstate messages -->
The driver queries the field configuration from the lidar and activates field monitoring by sending cola commands "sEN LFErec 1" and "sEN LIDoutputstate 1" at startup. Field monitoring is deactivated when driver exits. During runtime, it’s possible to query, activate or deactivate monitoring using ros service ColaMsg with the following command (see section Cola commands):
rosservice call /sick_tim_7xx/ColaMsg "{request: 'sEN LFErec 1'}" # activate LFErec messages
rosservice call /sick_tim_7xx/ColaMsg "{request: 'sEN LFErec 0'}" # deactivate LFErec messages
rosservice call /sick_tim_7xx/ColaMsg "{request: 'sRN LFErec'}"   # query activation status of LFErec messages
rosservice call /sick_tim_7xx/ColaMsg "{request: 'sEN LIDoutputstate 1'}" # activate LIDoutputstate messages
rosservice call /sick_tim_7xx/ColaMsg "{request: 'sEN LIDoutputstate 0'}" # deactivate LIDoutputstate messages
rosservice call /sick_tim_7xx/ColaMsg "{request: 'sRN LIDoutputstate'}"   # query activation status of LIDoutputstate messages
rosservice call /sick_tim_7xx/ColaMsg "{request: 'sEN LIDinputstate 1'}"  # activate LIDinputstate messages
rosservice call /sick_tim_7xx/ColaMsg "{request: 'sEN LIDinputstate 0'}"  # deactivate LIDinputstate messages
rosservice call /sick_tim_7xx/ColaMsg "{request: 'sRN LIDinputstate'}"    # query activation status of LIDinputstate messages
LFErec and LIDoutputstate messages are defined in LFErecMsg.msg and LFErecFieldMsg.msg resp. LIDoutputstateMsg.msg and published on the following topics: "/sick_tim_7xxS/lferec" resp. "/sick_tim_7xxS/lidoutputstate".
** Lidar ** |
** lferec topic ** |
** lidoutputstate topic ** |
|---|---|---|
lms_1xx |
/sick_lms_1xx/lferec |
/sick_lms_1xx/lidoutputstate |
lms_5xx |
/sick_lms_5xx/lferec |
/sick_lms_5xx/lidoutputstate |
lms_7xx |
/sick_tim_7xx/lferec |
/sick_tim_7xx/lidoutputstate |
lms_7xxS |
/sick_tim_7xxS/lferec |
/sick_tim_7xxS/lidoutputstate |
To view the field monitoring messages, run
rostopic echo "/sick_lms_1xx/lferec"
rostopic echo "/sick_lms_1xx/lidoutputstate"
rostopic echo "/sick_lms_5xx/lferec"
rostopic echo "/sick_lms_5xx/lidoutputstate"
rostopic echo "/sick_tim_7xx/lferec"
rostopic echo "/sick_tim_7xx/lidoutputstate"
rostopic echo "/sick_tim_7xxS/lferec"
rostopic echo "/sick_tim_7xxS/lidoutputstate"
or use rviz to visualize monitored fields and their status (see section Visualization with rviz)
The most important values of the field monitoring messages are
field_index(uint8) andfield_result_mrs(uint8) for each field of a LFErec message with result status- 0: invalid / incorrect,
- 1: free / clear, or
- 2: infringed.
output_state(uint8) for each LIDoutputstate message with status 0 (not active), 1 (active) or 2 (not used).
Note: Field monitoring currently supports binary cola messages only, which is the default. If cola ascii is activated, please switch back to cola binary for field monitoring.
Visualization with rviz
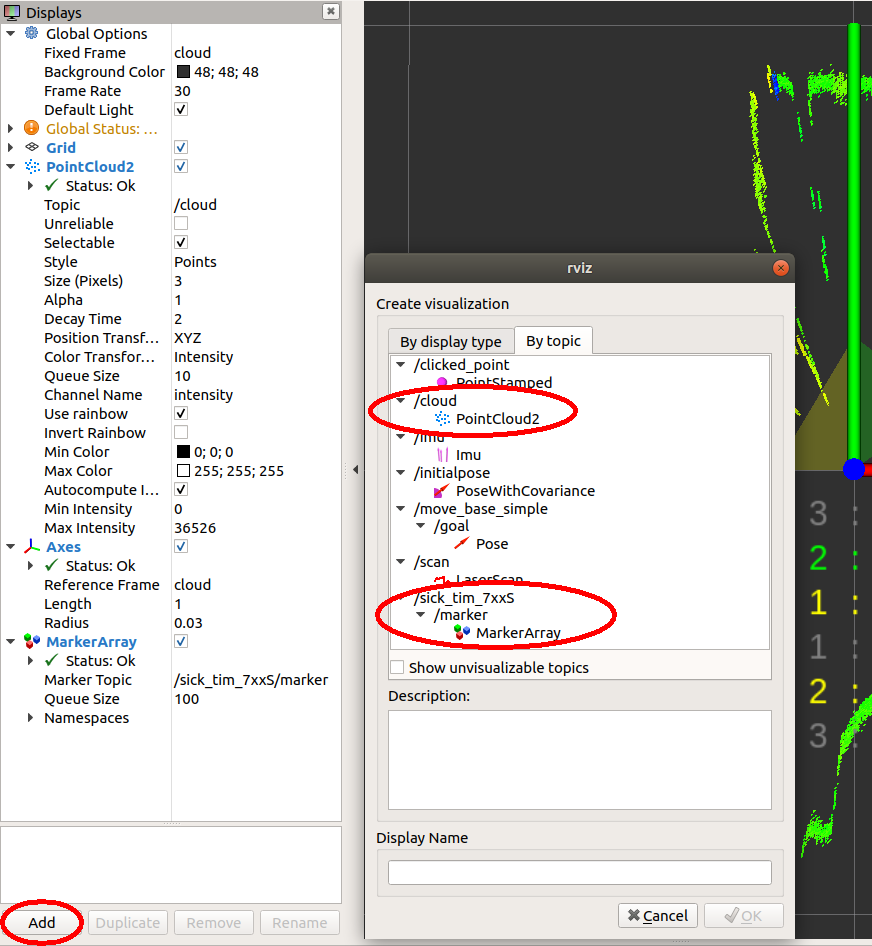
The point cloud, the monitored fields and their status can be visualized using rviz. Use the rviz configuration file and run
rosrun rviz rviz -d ./src/sick_scan_xd/test/emulator/config/rviz_emulator_cfg.rviz
Otherwise you can just add visualizations of type /cloud/PointCloud2 and /sick_tim_7xxS/marker (resp. /sick_tim_1xx/marker for lms_1xx, /sick_tim_5xx/marker for lms_5xx and /sick_tim_7xx/marker for tim_7xx):
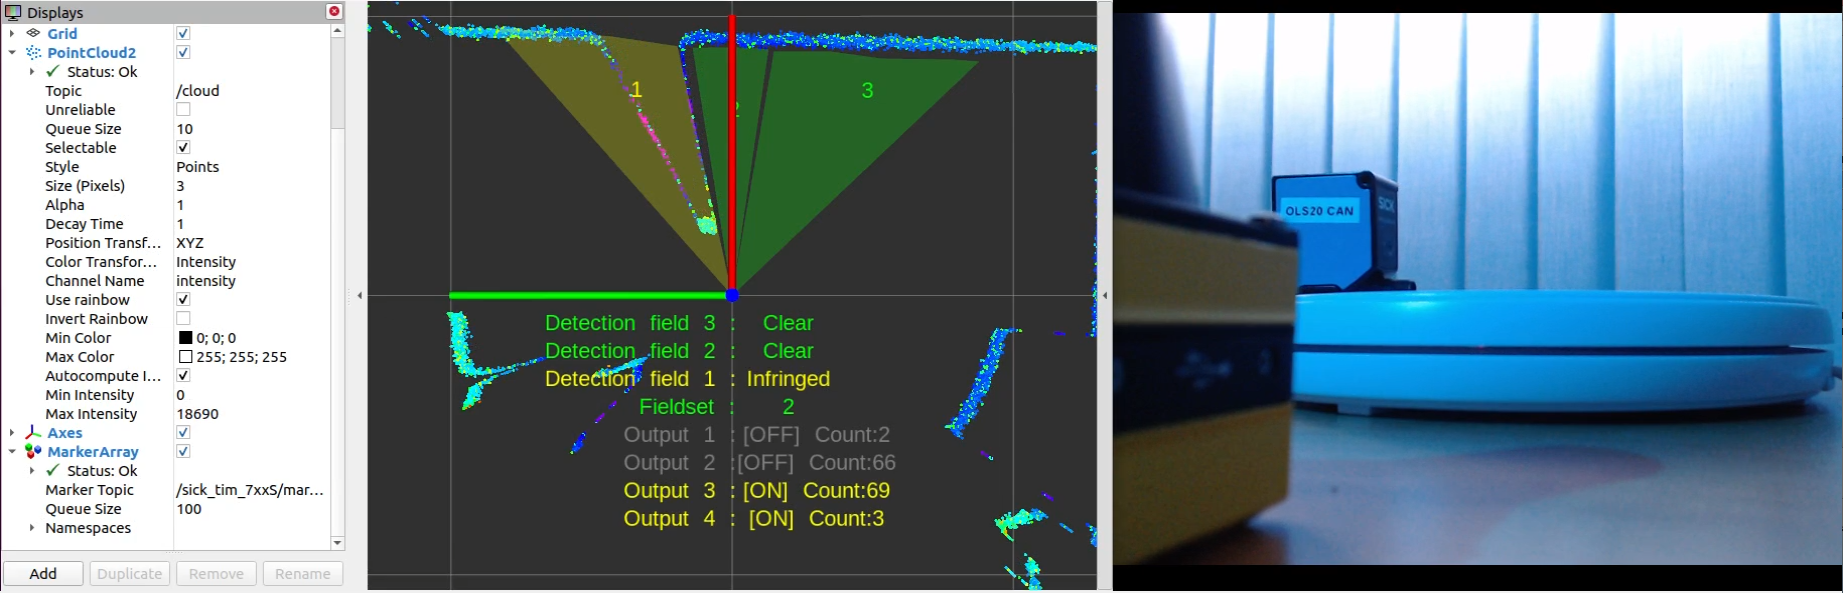
The following screenshot shows a TiM781S example with 2 fields (the 3. field is not configured), the first field with status “Clear”, the second with status “Infringed”:
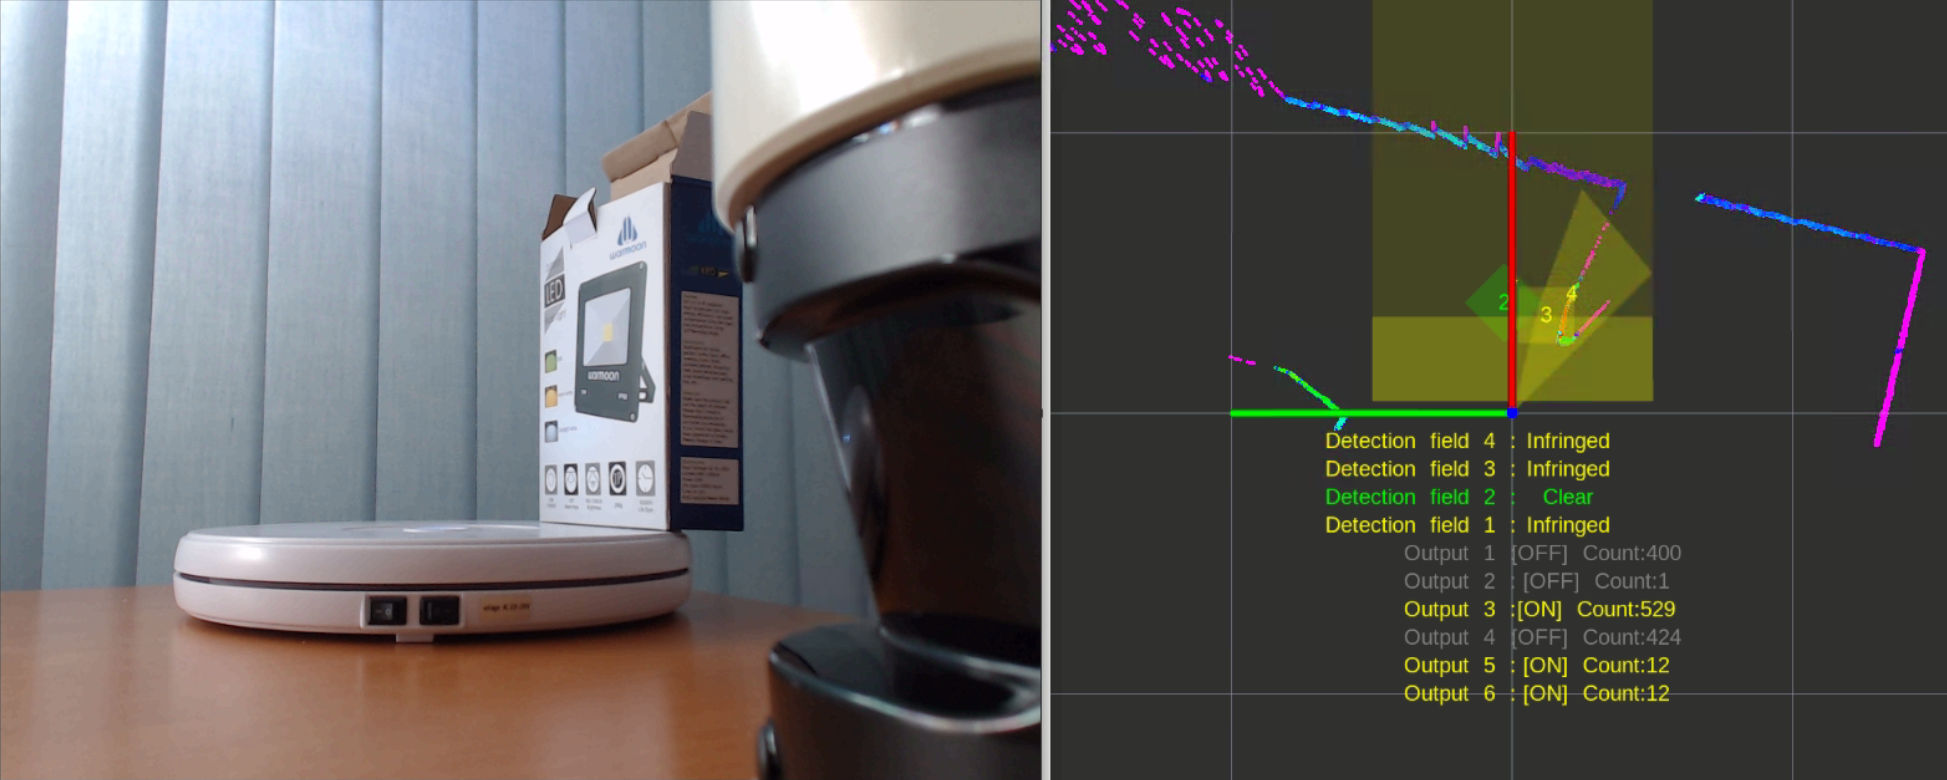
The following screenshot shows a LMS511 example with a segmented field, two rectangular fields and a dynamic fields:
Note: Some combinations of rviz, OpenGL 3, VMware and graphic card drivers may cause visualization issues. In case of missing markers, try rviz with Open GL 2 using the command
rosrun rviz rviz -d ./src/sick_scan_xd/test/emulator/config/rviz_emulator_cfg.rviz --opengl 210
Cola commands
Cola commands can be sent for diagnosis and development using the ros service ColaMsg. This service is implemented in sick_scan_xd and started by
<param name="start_services" type="bool" value="True"/>
in the launch file sick_tim_7xxS.launch (resp. sick_lms_1xx.launch, sick_lms_5xx.launch, sick_tim_7xx.launch ). The ros service sends the given cola command to the lidar and returns its response.
Example for cola command "sRN SCdevicestate" and response "sRA SCdevicestate \\x00" with error status 0 (no error):
rosservice call /sick_tim_7xx/ColaMsg "{request: 'sRN SCdevicestate'}"
response: "sRA SCdevicestate \\x00"
Tools, emulation and unittests
Package sick_scan_xd implements some tools to support unittests, development and emulation of Tim781S devices:
sick_scan_emulator to emulate lidar devices and enable unittests (currently for Tim781S only)
pcap_json_converter to convert pcapng-files to json.
LMS and TiM emulation
sick_scan_emulator implements a simple test server for cola commands. It rececives Cola-commands, returns Tim781S-like responses and sends Scandata from a json-file. Run
roslaunch sick_scan_xd emulator_01_default.launch
to emulate a local Tim781S device. Then start and connect the sick_scan_xd driver by
roslaunch sick_scan_xd sick_tim_7xxS.launch hostname:=127.0.0.1
Note that sick_scan_emulator just implements a simple server for offline tests. It does not emulate a lidar device completely and should only be used for development and testing.
Scandata messages are parsed from json-file(s). These json-files are configured in the launch file emulator.launch and converted form wireshark-records (pcapng-files) using pcap_json_converter.py (see section Pcapng converter tool](#pcapng-converter-tool)).
A LMS111 device can be emulated by running
roslaunch sick_scan_xd emulator_lms1xx.launch &
rosrun rviz rviz -d ./src/sick_scan_xd/test/emulator/config/rviz_lms1xx.rviz &
roslaunch sick_scan_xd sick_lms_1xx.launch hostname:=127.0.0.1
A LMS511 device can be emulated by running
roslaunch sick_scan_xd emulator_lms5xx.launch &
rosrun rviz rviz -d ./src/sick_scan_xd/test/emulator/config/rviz_lms5xx.rviz &
roslaunch sick_scan_xd sick_lms_5xx.launch hostname:=127.0.0.1
Unittests
Folder test/emulator/scandata contains scandata examples for unittests. To run an offline unittest for LMS111, LMS511, TiM781, TiM781S enter the following commands:
cd test/scripts
./run_simu_lms1xx.bash
./run_simu_lms5xx.bash
./run_simu_tim7xx_tim7xxS.bash
or start emulator, driver and rviz by running
source ./install/setup.bash
# Start sick_scan_xd emulator
roslaunch sick_scan_xd emulator_01_default.launch &
sleep 1
# Start rviz
rosrun rviz rviz -d ./src/sick_scan_xd/test/emulator/config/rviz_emulator_cfg.rviz --opengl 210 &
sleep 1
# Start sick_scan_xd driver for TiM871S
roslaunch sick_scan_xd sick_tim_7xxS.launch hostname:=127.0.0.1
Pcapng converter tool
The pcapng converter tool pcap_json_converter.py converts pcapng-files to json-files. Run the following steps to create a json-file with scandata for the emulator:
Start wireshark and filter the tcp traffic on port 2112 with the filter expression
tcp and tcp.port==2112.Start TiM781S and run the sick_scan_xd driver.
Capture the network traffic for some time.
Stop capturing and save the network traffic in a pcapng-file.
Convert the pcapng-file to json by
python pcap_json_converter.py --pcap_filename=<filepath>.pcapng. Result is a jsonfile<filepath>.pcapng.jsonSet the resulting json-file in the emulator configuration emulator.launch by
<arg name="scandatafiles" default="<filepath>.pcapng.json"/>