You're reading the documentation for an older, but still supported, version of ROS 2. For information on the latest version, please have a look at Kilted.
Marker: Points and Lines (C++)
Goal: Show how to use visualization_msgs/msg/Marker messages to send points and lines to RViz.
Tutorial level: Intermediate
Time: 15 Minutes
Note
This tutorial assumes that you have completed Marker: Sending Basic Shapes.
Intro
In Marker: Sending Basic Shapes you learned how to send simple shapes to RViz using visualization markers.
You can send more than just simple shapes, and this tutorial introduces the POINTS, LINE_STRIP, and LINE_LIST marker types.
For a full list of types, see Marker: Display types.
Using Points, Line Strips, and Line Lists
The POINTS, LINE_STRIP, and LINE_LIST markers all use the points member of the visualization_msgs/msg/Marker message.
The POINTS type places a point at each point added.
The LINE_STRIP type uses each point as a vertex in a connected set of lines, where point 0 is connected to point 1, 1 to 2, 2 to 3, and so on.
The LINE_LIST type creates unconnected lines out of each pair of points, such as point 0 to 1, 2 to 3, and so on.
The code
Get the package from the visualization_tutorials repository.
The code for this tutorial lives in the visualization_marker_tutorials package.
You can read it in points_and_lines.cpp.
The code explained
Now let’s break down the code, skipping things that were explained in the previous tutorial. The overall effect created is a rotating helix with lines sticking upwards from each vertex.
We start with the headers used by the node, including cmath for the helix and the messages used for markers and points.
#define _USE_MATH_DEFINES

#include <chrono>
#include <cmath>
#include <memory>

#include "rclcpp/rclcpp.hpp"
#include "geometry_msgs/msg/point.hpp"
#include "visualization_msgs/msg/marker.hpp"
This should look familiar.
We initialize ROS 2, create a node, create a publisher on the visualization_marker topic, and set the loop rate.
rclcpp::init(argc, argv);
auto node = rclcpp::Node::make_shared("points_and_lines");
auto marker_pub = node->create_publisher<visualization_msgs::msg::Marker>(
  "visualization_marker", 10);
rclcpp::Rate loop_rate(30);
We also create a floating-point variable that will be used to animate the helix over time.
float f = 0.0f;
Inside the main loop, we create three visualization_msgs/msg/Marker messages and initialize all of their shared data.
By default, a marker message contains a pose whose quaternion is initialized to the identity orientation, so we only need to set the fields that matter for this tutorial.
visualization_msgs::msg::Marker points, line_strip, line_list;
points.header.frame_id = line_strip.header.frame_id = line_list.header.frame_id = "my_frame";
points.header.stamp = line_strip.header.stamp = line_list.header.stamp = rclcpp::Clock().now();
points.ns = line_strip.ns = line_list.ns = "points_and_lines";
points.action = line_strip.action = line_list.action = visualization_msgs::msg::Marker::ADD;
Here we assign three different IDs to the three markers.
The use of the points_and_lines namespace ensures they will not collide with other marker publishers.
points.id = 0;
line_strip.id = 1;
line_list.id = 2;
Here we set the marker types to POINTS, LINE_STRIP, and LINE_LIST.
points.type = visualization_msgs::msg::Marker::POINTS;
line_strip.type = visualization_msgs::msg::Marker::LINE_STRIP;
line_list.type = visualization_msgs::msg::Marker::LINE_LIST;
The scale member means different things for these marker types.
POINTS markers use the x and y members for width and height respectively, while LINE_STRIP and LINE_LIST markers use only the x component, which defines the line width.
Scale values are in meters.
points.scale.x = 0.2;
points.scale.y = 0.2;

line_strip.scale.x = 0.1;
line_list.scale.x = 0.1;
Here we set the points to green, the line strip to blue, and the line list to red. As with other markers, the alpha channel must be non-zero.
points.color.g = 1.0f;
points.color.a = 1.0;

line_strip.color.b = 1.0;
line_strip.color.a = 1.0;

line_list.color.r = 1.0;
line_list.color.a = 1.0;
Now we create the vertices for the points and lines.
We use sine and cosine to generate a helix.
The POINTS and LINE_STRIP markers both require only one point for each vertex, while the LINE_LIST marker requires two points for each line segment.
for (uint32_t i = 0; i < 100; ++i) {
  float y = 5 * sin(f + i / 100.0f * 2 * M_PI);
  float z = 5 * cos(f + i / 100.0f * 2 * M_PI);

  geometry_msgs::msg::Point p;
  p.x = static_cast<int32_t>(i) - 50;
  p.y = y;
  p.z = z;

  points.points.push_back(p);
  line_strip.points.push_back(p);

  // The line list needs two points for each line
  line_list.points.push_back(p);
  p.z += 1.0;
  line_list.points.push_back(p);
}
Once the marker messages are filled out, we publish all three of them.
marker_pub->publish(points);
marker_pub->publish(line_strip);
marker_pub->publish(line_list);
Then we sleep, advance the animation phase, and loop back to the top.
loop_rate.sleep();
f += 0.04f;
Viewing the markers
Build the package in your workspace:
$ colcon build --packages-select visualization_marker_tutorials
Then source your workspace and run the node:
$ source install/setup.bash
$ ros2 run visualization_marker_tutorials points_and_lines
Now run RViz:
$ source install/setup.bash
$ ros2 run rviz2 rviz2
If you have never used RViz before, start with the RViz User Guide.
Set up RViz the same way you did in the last tutorial.
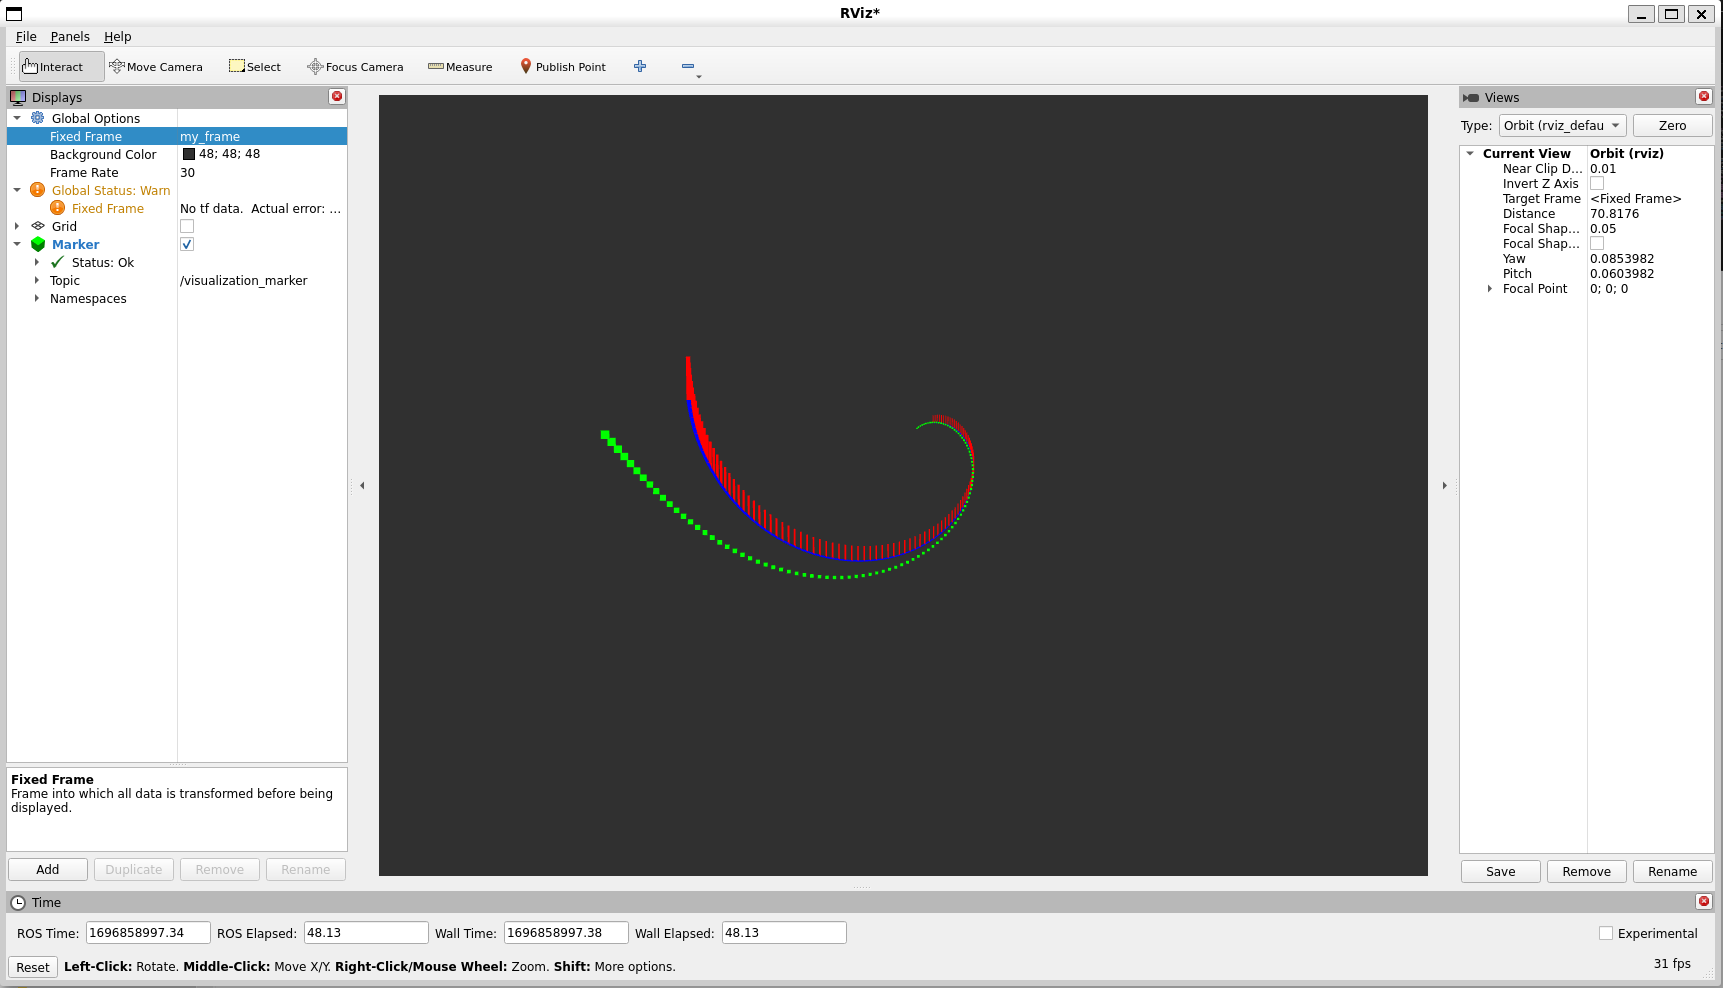
Because we do not have any transforms set up, set the Fixed Frame to my_frame.
Then add a Marker display.
The default topic, visualization_marker, is the same one being published by the node.
You should see a rotating helix that looks something like this:
Next steps
For more information about the markers and options supported by RViz, continue with Marker: Display types. Try out some of the other marker types.