#include <map>#include <string>#include <iostream>#include <boost/thread.hpp>#include "ompl/util/Time.h"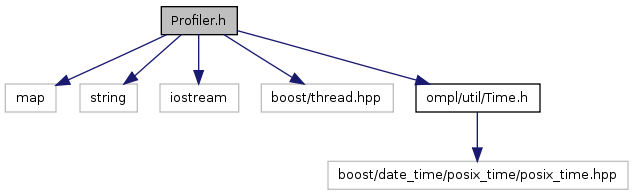
Go to the source code of this file.
Classes | |
| class | ompl::Profiler::BeginBlock |
| This instance will call Profiler::begin() when constructed and Profiler::end() when it goes out of scope. More... | |
| struct | ompl::Profiler::PerThread |
| Timing information to be maintained for each thread. More... | |
| class | ompl::Profiler |
| This is a simple thread-safe tool for counting time spent in various chunks of code. This is different from external profiling tools in that it allows the user to count time spent in various bits of code (sub-function granularity) or count how many times certain pieces of code are executed. More... | |
| struct | ompl::Profiler::TimeInfo |
| Information about time spent in a section of the code. More... | |
Namespaces | |
| namespace | ompl |
Main namespace. Contains everything in this library. | |
Defines | |
| #define | ENABLE_PROFILING 1 |
| #define ENABLE_PROFILING 1 |
Definition at line 41 of file Profiler.h.

