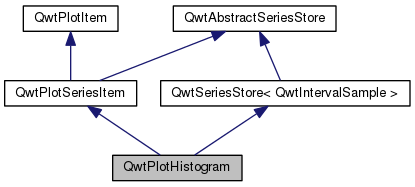
QwtPlotHistogram represents a series of samples, where an interval is associated with a value ( ![$y = f([x1,x2])$](form_1.png) ).
More...
).
More...
#include <qwt_plot_histogram.h>
Classes | |
| class | PrivateData |
Public Types | |
| enum | HistogramStyle { Outline, Columns, Lines, UserStyle = 100 } |
Public Member Functions | |
| double | baseline () const |
| virtual QRectF | boundingRect () const |
| const QBrush & | brush () const |
| virtual void | drawSeries (QPainter *p, const QwtScaleMap &xMap, const QwtScaleMap &yMap, const QRectF &canvasRect, int from, int to) const |
| virtual QwtGraphic | legendIcon (int index, const QSizeF &) const |
| const QPen & | pen () const |
| QwtPlotHistogram (const QString &title=QString::null) | |
| QwtPlotHistogram (const QwtText &title) | |
| virtual int | rtti () const |
| void | setBaseline (double reference) |
| Set the value of the baseline. | |
| void | setBrush (const QBrush &) |
| void | setPen (const QColor &, qreal width=0.0, Qt::PenStyle=Qt::SolidLine) |
| void | setPen (const QPen &) |
| void | setSamples (const QVector< QwtIntervalSample > &) |
| void | setSamples (QwtSeriesData< QwtIntervalSample > *) |
| void | setStyle (HistogramStyle style) |
| void | setSymbol (const QwtColumnSymbol *) |
| Assign a symbol. | |
| HistogramStyle | style () const |
| const QwtColumnSymbol * | symbol () const |
| virtual | ~QwtPlotHistogram () |
| Destructor. | |
Protected Member Functions | |
| virtual QwtColumnRect | columnRect (const QwtIntervalSample &, const QwtScaleMap &, const QwtScaleMap &) const |
| virtual void | drawColumn (QPainter *, const QwtColumnRect &, const QwtIntervalSample &) const |
| void | drawColumns (QPainter *, const QwtScaleMap &xMap, const QwtScaleMap &yMap, int from, int to) const |
| void | drawLines (QPainter *, const QwtScaleMap &xMap, const QwtScaleMap &yMap, int from, int to) const |
| void | drawOutline (QPainter *, const QwtScaleMap &xMap, const QwtScaleMap &yMap, int from, int to) const |
Private Member Functions | |
| void | flushPolygon (QPainter *, double baseLine, QPolygonF &) const |
| Internal, used by the Outline style. | |
| void | init () |
| Initialize data members. | |
Private Attributes | |
| PrivateData * | d_data |
Detailed Description
QwtPlotHistogram represents a series of samples, where an interval is associated with a value ( ).
The representation depends on the style() and an optional symbol() that is displayed for each interval.
- Note:
- The term "histogram" is used in a different way in the areas of digital image processing and statistics. Wikipedia introduces the terms "image histogram" and "color histogram" to avoid confusions. While "image histograms" can be displayed by a QwtPlotCurve there is no applicable plot item for a "color histogram" yet.
- See also:
- QwtPlotBarChart, QwtPlotMultiBarChart
Definition at line 39 of file qwt_plot_histogram.h.
Member Enumeration Documentation
Histogram styles. The default style is QwtPlotHistogram::Columns.
- See also:
- setStyle(), style(), setSymbol(), symbol(), setBaseline()
- Enumerator:
Outline Draw an outline around the area, that is build by all intervals using the pen() and fill it with the brush(). The outline style requires, that the intervals are in increasing order and not overlapping.
Columns Draw a column for each interval. When a symbol() has been set the symbol is used otherwise the column is displayed as plain rectangle using pen() and brush().
Lines Draw a simple line using the pen() for each interval.
UserStyle Styles >= UserStyle are reserved for derived classes that overload drawSeries() with additional application specific ways to display a histogram.
Definition at line 49 of file qwt_plot_histogram.h.
Constructor & Destructor Documentation
| QwtPlotHistogram::QwtPlotHistogram | ( | const QString & | title = QString::null | ) | [explicit] |
Constructor
- Parameters:
-
title Title of the histogram.
Definition at line 73 of file qwt_plot_histogram.cpp.
| QwtPlotHistogram::QwtPlotHistogram | ( | const QwtText & | title | ) | [explicit] |
Constructor
- Parameters:
-
title Title of the histogram.
Definition at line 63 of file qwt_plot_histogram.cpp.
| QwtPlotHistogram::~QwtPlotHistogram | ( | ) | [virtual] |
Destructor.
Definition at line 80 of file qwt_plot_histogram.cpp.
Member Function Documentation
| double QwtPlotHistogram::baseline | ( | ) | const |
- Returns:
- Value of the baseline
- See also:
- setBaseline()
Definition at line 252 of file qwt_plot_histogram.cpp.
| QRectF QwtPlotHistogram::boundingRect | ( | ) | const [virtual] |
- Returns:
- Bounding rectangle of all samples. For an empty series the rectangle is invalid.
Reimplemented from QwtPlotSeriesItem.
Definition at line 261 of file qwt_plot_histogram.cpp.
| const QBrush & QwtPlotHistogram::brush | ( | ) | const |
- Returns:
- Brush used in a style() depending way.
Definition at line 188 of file qwt_plot_histogram.cpp.
| QwtColumnRect QwtPlotHistogram::columnRect | ( | const QwtIntervalSample & | sample, |
| const QwtScaleMap & | xMap, | ||
| const QwtScaleMap & | yMap | ||
| ) | const [protected, virtual] |
Calculate the area that is covered by a sample
- Parameters:
-
sample Sample xMap Maps x-values into pixel coordinates. yMap Maps y-values into pixel coordinates.
- Returns:
- Rectangle, that is covered by a sample
Definition at line 599 of file qwt_plot_histogram.cpp.
| void QwtPlotHistogram::drawColumn | ( | QPainter * | painter, |
| const QwtColumnRect & | rect, | ||
| const QwtIntervalSample & | sample | ||
| ) | const [protected, virtual] |
Draw a column for a sample in Columns style().
When a symbol() has been set the symbol is used otherwise the column is displayed as plain rectangle using pen() and brush().
- Parameters:
-
painter Painter rect Rectangle where to paint the column in paint device coordinates sample Sample to be displayed
- Note:
- In applications, where different intervals need to be displayed in a different way ( f.e different colors or even using different symbols) it is recommended to overload drawColumn().
Definition at line 650 of file qwt_plot_histogram.cpp.
| void QwtPlotHistogram::drawColumns | ( | QPainter * | painter, |
| const QwtScaleMap & | xMap, | ||
| const QwtScaleMap & | yMap, | ||
| int | from, | ||
| int | to | ||
| ) | const [protected] |
Draw a histogram in Columns style()
- Parameters:
-
painter Painter xMap Maps x-values into pixel coordinates. yMap Maps y-values into pixel coordinates. from Index of the first sample to be painted to Index of the last sample to be painted. If to < 0 the histogram will be painted to its last point.
- See also:
- setStyle(), style(), setSymbol(), drawColumn()
Definition at line 458 of file qwt_plot_histogram.cpp.
| void QwtPlotHistogram::drawLines | ( | QPainter * | painter, |
| const QwtScaleMap & | xMap, | ||
| const QwtScaleMap & | yMap, | ||
| int | from, | ||
| int | to | ||
| ) | const [protected] |
Draw a histogram in Lines style()
- Parameters:
-
painter Painter xMap Maps x-values into pixel coordinates. yMap Maps y-values into pixel coordinates. from Index of the first sample to be painted to Index of the last sample to be painted. If to < 0 the histogram will be painted to its last point.
- See also:
- setStyle(), style(), setPen()
Definition at line 490 of file qwt_plot_histogram.cpp.
| void QwtPlotHistogram::drawOutline | ( | QPainter * | painter, |
| const QwtScaleMap & | xMap, | ||
| const QwtScaleMap & | yMap, | ||
| int | from, | ||
| int | to | ||
| ) | const [protected] |
Draw a histogram in Outline style()
- Parameters:
-
painter Painter xMap Maps x-values into pixel coordinates. yMap Maps y-values into pixel coordinates. from Index of the first sample to be painted to Index of the last sample to be painted. If to < 0 the histogram will be painted to its last point.
- See also:
- setStyle(), style()
- Warning:
- The outline style requires, that the intervals are in increasing order and not overlapping.
Definition at line 373 of file qwt_plot_histogram.cpp.
| void QwtPlotHistogram::drawSeries | ( | QPainter * | painter, |
| const QwtScaleMap & | xMap, | ||
| const QwtScaleMap & | yMap, | ||
| const QRectF & | canvasRect, | ||
| int | from, | ||
| int | to | ||
| ) | const [virtual] |
Draw a subset of the histogram samples
- Parameters:
-
painter Painter xMap Maps x-values into pixel coordinates. yMap Maps y-values into pixel coordinates. canvasRect Contents rectangle of the canvas from Index of the first sample to be painted to Index of the last sample to be painted. If to < 0 the series will be painted to its last sample.
- See also:
- drawOutline(), drawLines(), drawColumns
Implements QwtPlotSeriesItem.
Definition at line 333 of file qwt_plot_histogram.cpp.
| void QwtPlotHistogram::flushPolygon | ( | QPainter * | painter, |
| double | baseLine, | ||
| QPolygonF & | polygon | ||
| ) | const [private] |
Internal, used by the Outline style.
Definition at line 549 of file qwt_plot_histogram.cpp.
| void QwtPlotHistogram::init | ( | ) | [private] |
Initialize data members.
Definition at line 86 of file qwt_plot_histogram.cpp.
| QwtGraphic QwtPlotHistogram::legendIcon | ( | int | index, |
| const QSizeF & | size | ||
| ) | const [virtual] |
A plain rectangle without pen using the brush()
- Parameters:
-
index Index of the legend entry ( ignored as there is only one ) size Icon size
- Returns:
- A graphic displaying the icon
Reimplemented from QwtPlotItem.
Definition at line 685 of file qwt_plot_histogram.cpp.
| const QPen & QwtPlotHistogram::pen | ( | ) | const |
- Returns:
- Pen used in a style() depending way.
Definition at line 162 of file qwt_plot_histogram.cpp.
| int QwtPlotHistogram::rtti | ( | ) | const [virtual] |
- Returns:
- QwtPlotItem::Rtti_PlotHistogram
Reimplemented from QwtPlotItem.
Definition at line 289 of file qwt_plot_histogram.cpp.
| void QwtPlotHistogram::setBaseline | ( | double | value | ) |
Set the value of the baseline.
Each column representing an QwtIntervalSample is defined by its interval and the interval between baseline and the value of the sample.
The default value of the baseline is 0.0.
- Parameters:
-
value Value of the baseline
- See also:
- baseline()
Definition at line 239 of file qwt_plot_histogram.cpp.
| void QwtPlotHistogram::setBrush | ( | const QBrush & | brush | ) |
Assign a brush, that is used in a style() depending way.
- Parameters:
-
brush New brush
Definition at line 173 of file qwt_plot_histogram.cpp.
| void QwtPlotHistogram::setPen | ( | const QColor & | color, |
| qreal | width = 0.0, |
||
| Qt::PenStyle | style = Qt::SolidLine |
||
| ) |
Build and assign a pen
In Qt5 the default pen width is 1.0 ( 0.0 in Qt4 ) what makes it non cosmetic ( see QPen::isCosmetic() ). This method has been introduced to hide this incompatibility.
- Parameters:
-
color Pen color width Pen width style Pen style
Definition at line 136 of file qwt_plot_histogram.cpp.
| void QwtPlotHistogram::setPen | ( | const QPen & | pen | ) |
Assign a pen, that is used in a style() depending way.
- Parameters:
-
pen New pen
Definition at line 147 of file qwt_plot_histogram.cpp.
| void QwtPlotHistogram::setSamples | ( | const QVector< QwtIntervalSample > & | samples | ) |
Initialize data with an array of samples.
- Parameters:
-
samples Vector of points
Definition at line 298 of file qwt_plot_histogram.cpp.
| void QwtPlotHistogram::setSamples | ( | QwtSeriesData< QwtIntervalSample > * | data | ) |
Assign a series of samples
setSamples() is just a wrapper for setData() without any additional value - beside that it is easier to find for the developer.
- Parameters:
-
data Data
- Warning:
- The item takes ownership of the data object, deleting it when its not used anymore.
Definition at line 314 of file qwt_plot_histogram.cpp.
| void QwtPlotHistogram::setStyle | ( | HistogramStyle | style | ) |
Set the histogram's drawing style
- Parameters:
-
style Histogram style
- See also:
- HistogramStyle, style()
Definition at line 103 of file qwt_plot_histogram.cpp.
| void QwtPlotHistogram::setSymbol | ( | const QwtColumnSymbol * | symbol | ) |
Assign a symbol.
In Column style an optional symbol can be assigned, that is responsible for displaying the rectangle that is defined by the interval and the distance between baseline() and value. When no symbol has been defined the area is displayed as plain rectangle using pen() and brush().
- See also:
- style(), symbol(), drawColumn(), pen(), brush()
- Note:
- In applications, where different intervals need to be displayed in a different way ( f.e different colors or even using different symbols) it is recommended to overload drawColumn().
Definition at line 207 of file qwt_plot_histogram.cpp.
- Returns:
- Style of the histogram
- See also:
- HistogramStyle, setStyle()
Definition at line 118 of file qwt_plot_histogram.cpp.
| const QwtColumnSymbol * QwtPlotHistogram::symbol | ( | ) | const |
- Returns:
- Current symbol or NULL, when no symbol has been assigned
- See also:
- setSymbol()
Definition at line 223 of file qwt_plot_histogram.cpp.
Member Data Documentation
PrivateData* QwtPlotHistogram::d_data [private] |
Reimplemented from QwtPlotSeriesItem.
Definition at line 135 of file qwt_plot_histogram.h.
The documentation for this class was generated from the following files: