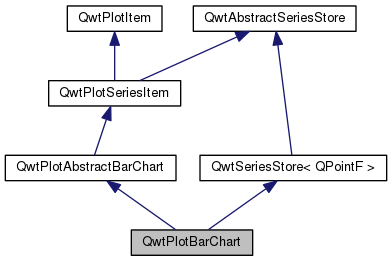
QwtPlotBarChart displays a series of a values as bars. More...
#include <qwt_plot_barchart.h>
Classes | |
| class | PrivateData |
Public Types | |
| enum | LegendMode { LegendChartTitle, LegendBarTitles } |
| Legend modes. More... | |
Public Member Functions | |
| virtual QwtText | barTitle (int sampleIndex) const |
| Return the title of a bar. | |
| virtual QRectF | boundingRect () const |
| virtual void | drawSeries (QPainter *painter, const QwtScaleMap &xMap, const QwtScaleMap &yMap, const QRectF &canvasRect, int from, int to) const |
| LegendMode | legendMode () const |
| QwtPlotBarChart (const QString &title=QString::null) | |
| QwtPlotBarChart (const QwtText &title) | |
| virtual int | rtti () const |
| void | setLegendMode (LegendMode) |
| void | setSamples (const QVector< QPointF > &) |
| void | setSamples (const QVector< double > &) |
| void | setSamples (QwtSeriesData< QPointF > *series) |
| void | setSymbol (QwtColumnSymbol *) |
| Assign a symbol. | |
| virtual QwtColumnSymbol * | specialSymbol (int sampleIndex, const QPointF &) const |
| const QwtColumnSymbol * | symbol () const |
| virtual | ~QwtPlotBarChart () |
| Destructor. | |
Protected Member Functions | |
| QwtColumnRect | columnRect (const QwtScaleMap &xMap, const QwtScaleMap &yMap, const QRectF &canvasRect, const QwtInterval &boundingInterval, const QPointF &sample) const |
| virtual void | drawBar (QPainter *, int sampleIndex, const QPointF &point, const QwtColumnRect &) const |
| virtual void | drawSample (QPainter *painter, const QwtScaleMap &xMap, const QwtScaleMap &yMap, const QRectF &canvasRect, const QwtInterval &boundingInterval, int index, const QPointF &sample) const |
| QList< QwtLegendData > | legendData () const |
| Return all information, that is needed to represent the item on the legend. | |
| QwtGraphic | legendIcon (int index, const QSizeF &) const |
Private Member Functions | |
| void | init () |
Private Attributes | |
| PrivateData * | d_data |
Detailed Description
QwtPlotBarChart displays a series of a values as bars.
Each bar might be customized individually by implementing a specialSymbol(). Otherwise it is rendered using a default symbol.
Depending on its orientation() the bars are displayed horizontally or vertically. The bars cover the interval between the baseline() and the value.
By activating the LegendBarTitles mode each sample will have its own entry on the legend.
The most common use case of a bar chart is to display a list of y coordinates, where the x coordinate is simply the index in the list. But for other situations ( f.e. when values are related to dates ) it is also possible to set x coordinates explicitly.
- See also:
- QwtPlotMultiBarChart, QwtPlotHistogram, QwtPlotCurve::Sticks, QwtPlotSeriesItem::orientation(), QwtPlotAbstractBarChart::baseline()
Definition at line 41 of file qwt_plot_barchart.h.
Member Enumeration Documentation
Legend modes.
The default setting is QwtPlotBarChart::LegendChartTitle.
- See also:
- setLegendMode(), legendMode()
- Enumerator:
LegendChartTitle One entry on the legend showing the default symbol and the title() of the chart
- See also:
- QwtPlotItem::title()
LegendBarTitles One entry for each value showing the individual symbol of the corresponding bar and the bar title.
- See also:
- specialSymbol(), barTitle()
Definition at line 51 of file qwt_plot_barchart.h.
Constructor & Destructor Documentation
| QwtPlotBarChart::QwtPlotBarChart | ( | const QString & | title = QString::null | ) | [explicit] |
Constructor
- Parameters:
-
title Title of the curve
Definition at line 48 of file qwt_plot_barchart.cpp.
| QwtPlotBarChart::QwtPlotBarChart | ( | const QwtText & | title | ) | [explicit] |
Constructor
- Parameters:
-
title Title of the curve
Definition at line 38 of file qwt_plot_barchart.cpp.
| QwtPlotBarChart::~QwtPlotBarChart | ( | ) | [virtual] |
Destructor.
Definition at line 55 of file qwt_plot_barchart.cpp.
Member Function Documentation
| QwtText QwtPlotBarChart::barTitle | ( | int | sampleIndex | ) | const [virtual] |
Return the title of a bar.
In LegendBarTitles mode the title is displayed on the legend entry corresponding to a bar.
The default implementation is a dummy, that is intended to be overloaded.
- Parameters:
-
sampleIndex Index of the bar
- Returns:
- An empty text
- See also:
- LegendBarTitles
Definition at line 394 of file qwt_plot_barchart.cpp.
| QRectF QwtPlotBarChart::boundingRect | ( | ) | const [virtual] |
- Returns:
- Bounding rectangle of all samples. For an empty series the rectangle is invalid.
Reimplemented from QwtPlotSeriesItem.
Definition at line 181 of file qwt_plot_barchart.cpp.
| QwtColumnRect QwtPlotBarChart::columnRect | ( | const QwtScaleMap & | xMap, |
| const QwtScaleMap & | yMap, | ||
| const QRectF & | canvasRect, | ||
| const QwtInterval & | boundingInterval, | ||
| const QPointF & | sample | ||
| ) | const [protected] |
Calculate the geometry of a bar in widget coordinates
- Parameters:
-
xMap x map yMap y map canvasRect Contents rect of the canvas boundingInterval Bounding interval of sample values sample Value of the sample
- Returns:
- Geometry of the column
Definition at line 257 of file qwt_plot_barchart.cpp.
| void QwtPlotBarChart::drawBar | ( | QPainter * | painter, |
| int | sampleIndex, | ||
| const QPointF & | sample, | ||
| const QwtColumnRect & | rect | ||
| ) | const [protected, virtual] |
Draw a bar
- Parameters:
-
painter Painter sampleIndex Index of the sample represented by the bar sample Value of the sample rect Bounding rectangle of the bar
Definition at line 336 of file qwt_plot_barchart.cpp.
| void QwtPlotBarChart::drawSample | ( | QPainter * | painter, |
| const QwtScaleMap & | xMap, | ||
| const QwtScaleMap & | yMap, | ||
| const QRectF & | canvasRect, | ||
| const QwtInterval & | boundingInterval, | ||
| int | index, | ||
| const QPointF & | sample | ||
| ) | const [protected, virtual] |
Draw a sample
- Parameters:
-
painter Painter xMap x map yMap y map canvasRect Contents rect of the canvas boundingInterval Bounding interval of sample values index Index of the sample sample Value of the sample
- See also:
- drawSeries()
Definition at line 317 of file qwt_plot_barchart.cpp.
| void QwtPlotBarChart::drawSeries | ( | QPainter * | painter, |
| const QwtScaleMap & | xMap, | ||
| const QwtScaleMap & | yMap, | ||
| const QRectF & | canvasRect, | ||
| int | from, | ||
| int | to | ||
| ) | const [virtual] |
Draw an interval of the bar chart
- Parameters:
-
painter Painter xMap Maps x-values into pixel coordinates. yMap Maps y-values into pixel coordinates. canvasRect Contents rect of the canvas from Index of the first point to be painted to Index of the last point to be painted. If to < 0 the curve will be painted to its last point.
- See also:
- drawSymbols()
Implements QwtPlotSeriesItem.
Definition at line 218 of file qwt_plot_barchart.cpp.
| void QwtPlotBarChart::init | ( | ) | [private] |
Definition at line 60 of file qwt_plot_barchart.cpp.
| QList< QwtLegendData > QwtPlotBarChart::legendData | ( | ) | const [protected, virtual] |
Return all information, that is needed to represent the item on the legend.
In case of LegendBarTitles an entry for each bar is returned, otherwise the chart is represented like any other plot item from its title() and the legendIcon().
- Returns:
- Information, that is needed to represent the item on the legend
- See also:
- title(), setLegendMode(), barTitle(), QwtLegend, QwtPlotLegendItem
Reimplemented from QwtPlotItem.
Definition at line 411 of file qwt_plot_barchart.cpp.
| QwtGraphic QwtPlotBarChart::legendIcon | ( | int | index, |
| const QSizeF & | size | ||
| ) | const [protected, virtual] |
- Returns:
- Icon representing a bar or the chart on the legend
When the legendMode() is LegendBarTitles the icon shows the bar corresponding to index - otherwise the bar displays the default symbol.
- Parameters:
-
index Index of the legend entry size Icon size
Reimplemented from QwtPlotItem.
Definition at line 459 of file qwt_plot_barchart.cpp.
| int QwtPlotBarChart::rtti | ( | ) | const [virtual] |
- Returns:
- QwtPlotItem::Rtti_PlotBarChart
Reimplemented from QwtPlotItem.
Definition at line 67 of file qwt_plot_barchart.cpp.
| void QwtPlotBarChart::setLegendMode | ( | LegendMode | mode | ) |
Set the mode that decides what to display on the legend
In case of LegendBarTitles barTitle() needs to be overloaded to return individual titles for each bar.
- Parameters:
-
mode New mode
- See also:
- legendMode(), legendData(), barTitle(), QwtPlotItem::ItemAttribute
Definition at line 159 of file qwt_plot_barchart.cpp.
| void QwtPlotBarChart::setSamples | ( | const QVector< QPointF > & | samples | ) |
Initialize data with an array of points
- Parameters:
-
samples Vector of points
- Note:
- QVector is implicitly shared
- QPolygonF is derived from QVector<QPointF>
Definition at line 79 of file qwt_plot_barchart.cpp.
| void QwtPlotBarChart::setSamples | ( | const QVector< double > & | samples | ) |
Initialize data with an array of doubles
The indices in the array are taken as x coordinate, while the doubles are interpreted as y values.
- Parameters:
-
samples Vector of y coordinates
- Note:
- QVector is implicitly shared
Definition at line 94 of file qwt_plot_barchart.cpp.
| void QwtPlotBarChart::setSamples | ( | QwtSeriesData< QPointF > * | data | ) |
Assign a series of samples
setSamples() is just a wrapper for setData() without any additional value - beside that it is easier to find for the developer.
- Parameters:
-
data Data
- Warning:
- The item takes ownership of the data object, deleting it when its not used anymore.
Definition at line 114 of file qwt_plot_barchart.cpp.
| void QwtPlotBarChart::setSymbol | ( | QwtColumnSymbol * | symbol | ) |
Assign a symbol.
The bar chart will take the ownership of the symbol, hence the previously set symbol will be delete by setting a new one. If symbol is NULL no symbol will be drawn.
- Parameters:
-
symbol Symbol
- See also:
- symbol()
Definition at line 129 of file qwt_plot_barchart.cpp.
| QwtColumnSymbol * QwtPlotBarChart::specialSymbol | ( | int | sampleIndex, |
| const QPointF & | sample | ||
| ) | const [virtual] |
Needs to be overloaded to return a non default symbol for a specific sample
- Parameters:
-
sampleIndex Index of the sample represented by the bar sample Value of the sample
- Returns:
- NULL, indicating to use the default symbol
Definition at line 372 of file qwt_plot_barchart.cpp.
| const QwtColumnSymbol * QwtPlotBarChart::symbol | ( | ) | const |
- Returns:
- Current symbol or NULL, when no symbol has been assigned
- See also:
- setSymbol()
Definition at line 145 of file qwt_plot_barchart.cpp.
Member Data Documentation
PrivateData* QwtPlotBarChart::d_data [private] |
Reimplemented from QwtPlotAbstractBarChart.
Definition at line 119 of file qwt_plot_barchart.h.
The documentation for this class was generated from the following files: