Classes.
More...
|
| def | __init__ (self, parent=None) |
| |
| def | redraw (self) |
| |
| def | reset (self) |
| |
| def | __init__ (self, parent=None) |
| |
| def | add_curve (self, curve_id, curve_name, data_x, data_y) |
| |
| def | autoscroll (self, enabled=True) |
| |
| def | clear_values (self, curve_id=None) |
| |
| def | doSettingsDialog (self) |
| |
| def | get_xlim (self) |
| |
| def | get_ylim (self) |
| |
| def | getTitle (self) |
| |
| def | redraw (self) |
| |
| def | remove_curve (self, curve_id) |
| |
| def | restore_settings (self, plugin_settings, instance_settings) |
| |
| def | save_settings (self, plugin_settings, instance_settings) |
| |
| def | set_autoscale (self, x=None, y=None) |
| |
| def | set_xlim (self, limits) |
| |
| def | set_ylim (self, limits) |
| |
| def | update_values (self, curve_id, values_x, values_y, sort_data=True) |
| |
| def | vline (self, x, color=RED) |
| |
Classes.
Definition at line 20 of file full_size_data_plot.py.
| def kobuki_qtestsuite.full_size_data_plot.FullSizeDataPlot.__init__ |
( |
|
self, |
|
|
|
parent = None |
|
) |
| |
| def kobuki_qtestsuite.full_size_data_plot.FullSizeDataPlot._update_legend |
( |
|
self | ) |
|
|
private |
| def kobuki_qtestsuite.full_size_data_plot.FullSizeDataPlot.redraw |
( |
|
self | ) |
|
  We fix the y axis and continually resize the x axis to encapsulate
  the entire domain, range of the battery profile.

  @Todo : the domain is simply the data value, we could use
Definition at line 43 of file full_size_data_plot.py.
| def kobuki_qtestsuite.full_size_data_plot.FullSizeDataPlot.reset |
( |
|
self | ) |
|
| kobuki_qtestsuite.full_size_data_plot.FullSizeDataPlot._ymax |
|
private |
| kobuki_qtestsuite.full_size_data_plot.FullSizeDataPlot._ymin |
|
private |
| kobuki_qtestsuite.full_size_data_plot.FullSizeDataPlot.dynamic_range |
| kobuki_qtestsuite.full_size_data_plot.FullSizeDataPlot.max_range |
| kobuki_qtestsuite.full_size_data_plot.FullSizeDataPlot.min_range |
The documentation for this class was generated from the following file:
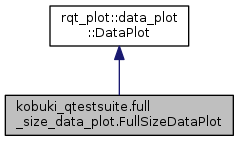
 Public Member Functions inherited from rqt_plot::data_plot::DataPlot