Curve that displays 3D points as dots, where the z coordinate is mapped to a color. More...
#include <qwt_plot_spectrocurve.h>
Classes | |
| class | PrivateData |
Public Types | |
| enum | PaintAttribute { ClipPoints = 1 } |
| Paint attributes. More... | |
| typedef QFlags< PaintAttribute > | PaintAttributes |
| Paint attributes. | |
Public Member Functions | |
| const QwtColorMap * | colorMap () const |
| QwtInterval & | colorRange () const |
| virtual void | drawSeries (QPainter *, const QwtScaleMap &xMap, const QwtScaleMap &yMap, const QRectF &canvasRect, int from, int to) const |
| double | penWidth () const |
| QwtPlotSpectroCurve (const QString &title=QString()) | |
| QwtPlotSpectroCurve (const QwtText &title) | |
| virtual int | rtti () const |
| void | setColorMap (QwtColorMap *) |
| void | setColorRange (const QwtInterval &) |
| void | setPaintAttribute (PaintAttribute, bool on=true) |
| void | setPenWidth (double width) |
| void | setSamples (const QVector< QwtPoint3D > &) |
| void | setSamples (QwtSeriesData< QwtPoint3D > *) |
| bool | testPaintAttribute (PaintAttribute) const |
| virtual | ~QwtPlotSpectroCurve () |
| Destructor. | |
Protected Member Functions | |
| virtual void | drawDots (QPainter *, const QwtScaleMap &xMap, const QwtScaleMap &yMap, const QRectF &canvasRect, int from, int to) const |
Private Member Functions | |
| void | init () |
| Initialize data members. | |
Private Attributes | |
| PrivateData * | d_data |
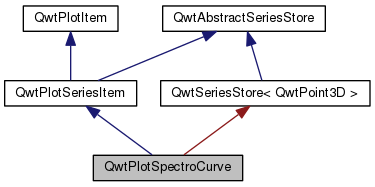
Detailed Description
Curve that displays 3D points as dots, where the z coordinate is mapped to a color.
Definition at line 24 of file qwt_plot_spectrocurve.h.
Member Typedef Documentation
| typedef QFlags<PaintAttribute> QwtPlotSpectroCurve::PaintAttributes |
Paint attributes.
Definition at line 36 of file qwt_plot_spectrocurve.h.
Member Enumeration Documentation
Paint attributes.
Definition at line 29 of file qwt_plot_spectrocurve.h.
Constructor & Destructor Documentation
| QwtPlotSpectroCurve::QwtPlotSpectroCurve | ( | const QString & | title = QString() | ) | [explicit] |
Constructor
- Parameters:
-
title Title of the curve
Definition at line 53 of file qwt_plot_spectrocurve.cpp.
| QwtPlotSpectroCurve::QwtPlotSpectroCurve | ( | const QwtText & | title | ) | [explicit] |
Constructor
- Parameters:
-
title Title of the curve
Definition at line 43 of file qwt_plot_spectrocurve.cpp.
| QwtPlotSpectroCurve::~QwtPlotSpectroCurve | ( | ) | [virtual] |
Destructor.
Definition at line 60 of file qwt_plot_spectrocurve.cpp.
Member Function Documentation
| const QwtColorMap * QwtPlotSpectroCurve::colorMap | ( | ) | const |
- Returns:
- Color Map used for mapping the intensity values to colors
- See also:
- setColorMap(), setColorRange(), QwtColorMap::color()
Definition at line 161 of file qwt_plot_spectrocurve.cpp.
| QwtInterval & QwtPlotSpectroCurve::colorRange | ( | ) | const |
- Returns:
- Value interval, that corresponds to the color map
- See also:
- setColorRange(), setColorMap(), QwtColorMap::color()
Definition at line 189 of file qwt_plot_spectrocurve.cpp.
| void QwtPlotSpectroCurve::drawDots | ( | QPainter * | painter, |
| const QwtScaleMap & | xMap, | ||
| const QwtScaleMap & | yMap, | ||
| const QRectF & | canvasRect, | ||
| int | from, | ||
| int | to | ||
| ) | const [protected, virtual] |
Draw a subset of the points
- Parameters:
-
painter Painter xMap Maps x-values into pixel coordinates. yMap Maps y-values into pixel coordinates. canvasRect Contents rectangle of the canvas from Index of the first sample to be painted to Index of the last sample to be painted. If to < 0 the series will be painted to its last sample.
- See also:
- drawSeries()
Definition at line 268 of file qwt_plot_spectrocurve.cpp.
| void QwtPlotSpectroCurve::drawSeries | ( | QPainter * | painter, |
| const QwtScaleMap & | xMap, | ||
| const QwtScaleMap & | yMap, | ||
| const QRectF & | canvasRect, | ||
| int | from, | ||
| int | to | ||
| ) | const [virtual] |
Draw a subset of the points
- Parameters:
-
painter Painter xMap Maps x-values into pixel coordinates. yMap Maps y-values into pixel coordinates. canvasRect Contents rectangle of the canvas from Index of the first sample to be painted to Index of the last sample to be painted. If to < 0 the series will be painted to its last sample.
- See also:
- drawDots()
Implements QwtPlotSeriesItem.
Definition at line 236 of file qwt_plot_spectrocurve.cpp.
| void QwtPlotSpectroCurve::init | ( | ) | [private] |
Initialize data members.
Definition at line 68 of file qwt_plot_spectrocurve.cpp.
| double QwtPlotSpectroCurve::penWidth | ( | ) | const |
- Returns:
- Pen width used to draw a dot
- See also:
- setPenWidth()
Definition at line 218 of file qwt_plot_spectrocurve.cpp.
| int QwtPlotSpectroCurve::rtti | ( | ) | const [virtual] |
Reimplemented from QwtPlotItem.
Definition at line 80 of file qwt_plot_spectrocurve.cpp.
| void QwtPlotSpectroCurve::setColorMap | ( | QwtColorMap * | colorMap | ) |
Change the color map
Often it is useful to display the mapping between intensities and colors as an additional plot axis, showing a color bar.
- Parameters:
-
colorMap Color Map
- See also:
- colorMap(), setColorRange(), QwtColorMap::color(), QwtScaleWidget::setColorBarEnabled(), QwtScaleWidget::setColorMap()
Definition at line 145 of file qwt_plot_spectrocurve.cpp.
| void QwtPlotSpectroCurve::setColorRange | ( | const QwtInterval & | interval | ) |
Set the value interval, that corresponds to the color map
- Parameters:
-
interval interval.minValue() corresponds to 0.0, interval.maxValue() to 1.0 on the color map.
- See also:
- colorRange(), setColorMap(), QwtColorMap::color()
Definition at line 174 of file qwt_plot_spectrocurve.cpp.
| void QwtPlotSpectroCurve::setPaintAttribute | ( | PaintAttribute | attribute, |
| bool | on = true |
||
| ) |
Specify an attribute how to draw the curve
- Parameters:
-
attribute Paint attribute on On/Off /sa PaintAttribute, testPaintAttribute()
Definition at line 92 of file qwt_plot_spectrocurve.cpp.
| void QwtPlotSpectroCurve::setPenWidth | ( | double | penWidth | ) |
Assign a pen width
- Parameters:
-
penWidth New pen width
- See also:
- penWidth()
Definition at line 200 of file qwt_plot_spectrocurve.cpp.
| void QwtPlotSpectroCurve::setSamples | ( | const QVector< QwtPoint3D > & | samples | ) |
Initialize data with an array of samples.
- Parameters:
-
samples Vector of points
Definition at line 113 of file qwt_plot_spectrocurve.cpp.
| void QwtPlotSpectroCurve::setSamples | ( | QwtSeriesData< QwtPoint3D > * | data | ) |
Assign a series of samples
setSamples() is just a wrapper for setData() without any additional value - beside that it is easier to find for the developer.
- Parameters:
-
data Data
- Warning:
- The item takes ownership of the data object, deleting it when its not used anymore.
Definition at line 128 of file qwt_plot_spectrocurve.cpp.
| bool QwtPlotSpectroCurve::testPaintAttribute | ( | PaintAttribute | attribute | ) | const |
- Returns:
- True, when attribute is enabled
- See also:
- PaintAttribute, setPaintAttribute()
Definition at line 104 of file qwt_plot_spectrocurve.cpp.
Member Data Documentation
PrivateData* QwtPlotSpectroCurve::d_data [private] |
Reimplemented from QwtPlotSeriesItem.
Definition at line 73 of file qwt_plot_spectrocurve.h.
The documentation for this class was generated from the following files: