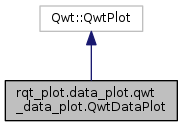
|
| def | __init__ (self, args) |
| |
| def | add_curve (self, curve_id, curve_name, curve_color=QColor(Qt.blue), markers_on=False) |
| |
| def | eventFilter (self, _, event) |
| |
| def | get_xlim (self) |
| |
| def | get_ylim (self) |
| |
| def | log (self, level, message) |
| |
| def | mouseMoveEvent (self, event) |
| |
| def | mousePressEvent (self, event) |
| |
| def | move_canvas (self, delta_x, delta_y) |
| |
| def | redraw (self) |
| |
| def | remove_curve (self, curve_id) |
| |
| def | rescale (self) |
| |
| def | rescale_axis_x (self, delta__x) |
| |
| def | resizeEvent (self, event) |
| |
| def | scale_axis_y (self, max_value) |
| |
| def | set_values (self, curve_id, data_x, data_y) |
| |
| def | set_xlim (self, limits) |
| |
| def | set_ylim (self, limits) |
| |
| def | vline (self, x, color) |
| |
| def | wheelEvent (self, event) |
| |
Definition at line 46 of file qwt_data_plot.py.
| def rqt_plot.data_plot.qwt_data_plot.QwtDataPlot.__init__ |
( |
|
self, |
|
|
|
args |
|
) |
| |
| def rqt_plot.data_plot.qwt_data_plot.QwtDataPlot.add_curve |
( |
|
self, |
|
|
|
curve_id, |
|
|
|
curve_name, |
|
|
|
curve_color = QColor(Qt.blue), |
|
|
|
markers_on = False |
|
) |
| |
| def rqt_plot.data_plot.qwt_data_plot.QwtDataPlot.eventFilter |
( |
|
self, |
|
|
|
_, |
|
|
|
event |
|
) |
| |
| def rqt_plot.data_plot.qwt_data_plot.QwtDataPlot.get_xlim |
( |
|
self | ) |
|
| def rqt_plot.data_plot.qwt_data_plot.QwtDataPlot.get_ylim |
( |
|
self | ) |
|
| def rqt_plot.data_plot.qwt_data_plot.QwtDataPlot.log |
( |
|
self, |
|
|
|
level, |
|
|
|
message |
|
) |
| |
| def rqt_plot.data_plot.qwt_data_plot.QwtDataPlot.mouseMoveEvent |
( |
|
self, |
|
|
|
event |
|
) |
| |
| def rqt_plot.data_plot.qwt_data_plot.QwtDataPlot.mousePressEvent |
( |
|
self, |
|
|
|
event |
|
) |
| |
| def rqt_plot.data_plot.qwt_data_plot.QwtDataPlot.move_canvas |
( |
|
self, |
|
|
|
delta_x, |
|
|
|
delta_y |
|
) |
| |
move the canvas by delta_x and delta_y in SCREEN COORDINATES
Definition at line 185 of file qwt_data_plot.py.
| def rqt_plot.data_plot.qwt_data_plot.QwtDataPlot.redraw |
( |
|
self | ) |
|
| def rqt_plot.data_plot.qwt_data_plot.QwtDataPlot.remove_curve |
( |
|
self, |
|
|
|
curve_id |
|
) |
| |
| def rqt_plot.data_plot.qwt_data_plot.QwtDataPlot.rescale |
( |
|
self | ) |
|
| def rqt_plot.data_plot.qwt_data_plot.QwtDataPlot.rescale_axis_x |
( |
|
self, |
|
|
|
delta__x |
|
) |
| |
| def rqt_plot.data_plot.qwt_data_plot.QwtDataPlot.resizeEvent |
( |
|
self, |
|
|
|
event |
|
) |
| |
| def rqt_plot.data_plot.qwt_data_plot.QwtDataPlot.scale_axis_y |
( |
|
self, |
|
|
|
max_value |
|
) |
| |
set the y axis height to max_value, about the current center
Definition at line 174 of file qwt_data_plot.py.
| def rqt_plot.data_plot.qwt_data_plot.QwtDataPlot.set_values |
( |
|
self, |
|
|
|
curve_id, |
|
|
|
data_x, |
|
|
|
data_y |
|
) |
| |
| def rqt_plot.data_plot.qwt_data_plot.QwtDataPlot.set_xlim |
( |
|
self, |
|
|
|
limits |
|
) |
| |
| def rqt_plot.data_plot.qwt_data_plot.QwtDataPlot.set_ylim |
( |
|
self, |
|
|
|
limits |
|
) |
| |
| def rqt_plot.data_plot.qwt_data_plot.QwtDataPlot.vline |
( |
|
self, |
|
|
|
x, |
|
|
|
color |
|
) |
| |
| def rqt_plot.data_plot.qwt_data_plot.QwtDataPlot.wheelEvent |
( |
|
self, |
|
|
|
event |
|
) |
| |
| rqt_plot.data_plot.qwt_data_plot.QwtDataPlot._canvas_display_height |
|
private |
| rqt_plot.data_plot.qwt_data_plot.QwtDataPlot._canvas_display_width |
|
private |
| rqt_plot.data_plot.qwt_data_plot.QwtDataPlot._curves |
|
private |
| rqt_plot.data_plot.qwt_data_plot.QwtDataPlot._last_canvas_x |
|
private |
| rqt_plot.data_plot.qwt_data_plot.QwtDataPlot._last_canvas_y |
|
private |
| rqt_plot.data_plot.qwt_data_plot.QwtDataPlot._last_click_coordinates |
|
private |
| int rqt_plot.data_plot.qwt_data_plot.QwtDataPlot._num_value_saved = 1000 |
|
staticprivate |
| int rqt_plot.data_plot.qwt_data_plot.QwtDataPlot._num_values_ploted = 1000 |
|
staticprivate |
| rqt_plot.data_plot.qwt_data_plot.QwtDataPlot._picker |
|
private |
| rqt_plot.data_plot.qwt_data_plot.QwtDataPlot._pressed_canvas_x |
|
private |
| rqt_plot.data_plot.qwt_data_plot.QwtDataPlot._pressed_canvas_y |
|
private |
| rqt_plot.data_plot.qwt_data_plot.QwtDataPlot._x_limits |
|
private |
| rqt_plot.data_plot.qwt_data_plot.QwtDataPlot._y_limits |
|
private |
| rqt_plot.data_plot.qwt_data_plot.QwtDataPlot.limits_changed = Signal() |
|
static |
| rqt_plot.data_plot.qwt_data_plot.QwtDataPlot.mouseCoordinatesChanged = Signal(QPointF) |
|
static |
The documentation for this class was generated from the following file:
